Challenge 12: Data Science Job Salaries
Dataset on Kaggle - See challenge questions below.
Link to GitHub repository, including data and final output.
Click the bottom right corner of the window above to view in full-screen mode.
1. About the dataset
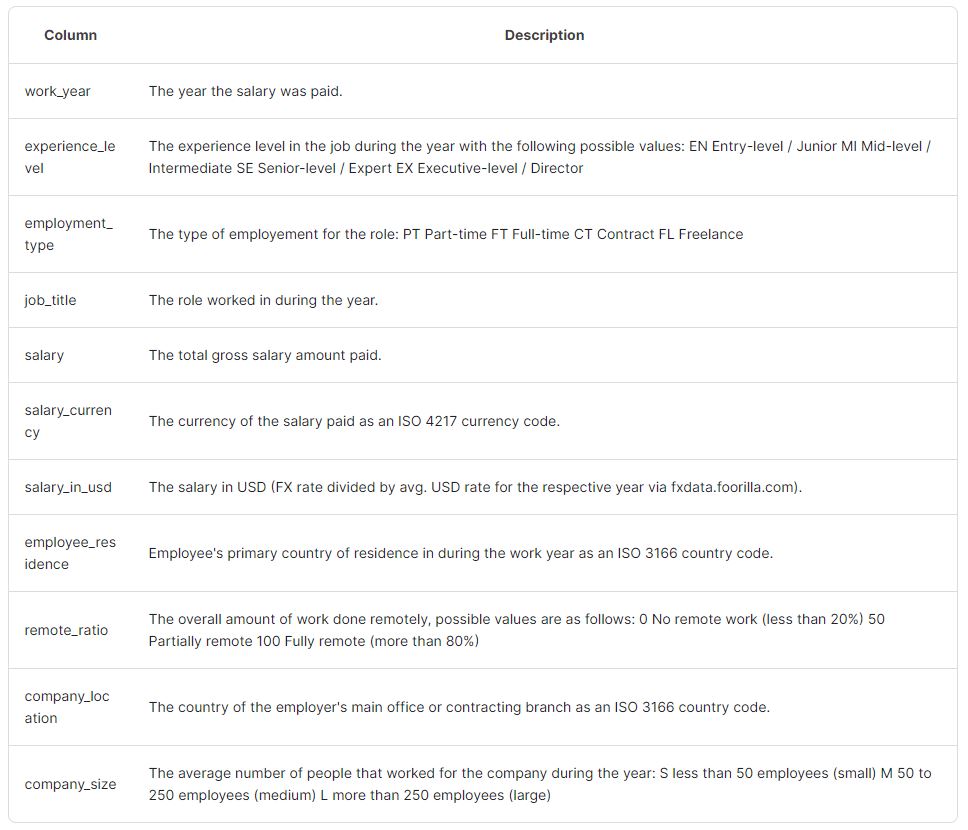
The dataset contains a table of records for data science positions and related information, such as salary, location, year recorded, experience level. A copy of the data dictionary is below.
 2. Challenge questions
There are nine questions in total, querying different aspects of the dataset.
- Which role has the highest salary employment wise?
- Which employment types do employers prefer to hire?
- Which role are entry leveled generally hired for?
- Which countries pay the highest for which roles?
- What insights can you find regarding employee demographics?
- Which experience level has the highest hiring?
- Does company size affect the rate of hiring and pay scale?
- What is the year over year (YoY) salary growth at different levels?
- Create a dashboard to summarize your insights.
- After importing the dataset to the Power Query Editor, double-checked the data type, distribution, and values matching the data dictionary.
- Named the first column as ID.
- Replaced job_title as Position
- Replaced acronyms in Experience, Employment type and Company size columns with more descriptive values.
- Imported and merged an ISO 3166 country code table and replaced the country codes with the country names.
- Removed non-USD salary columns.
Questions 1-8 were answered using Pivot tables (Summary Tab), from which I created the pivot charts for question 9 (Dashboard tab).